
Number Crunching!
- Apr 7, 2017
- 3 min read
Firstly, I will apologise for taking so long about writing this post. I had planned to explain what I was doing as I went along, but the report deadlines were looming. So, now I've submitted all my fieldwork reports, I'm back to explain the next step of the analysis...
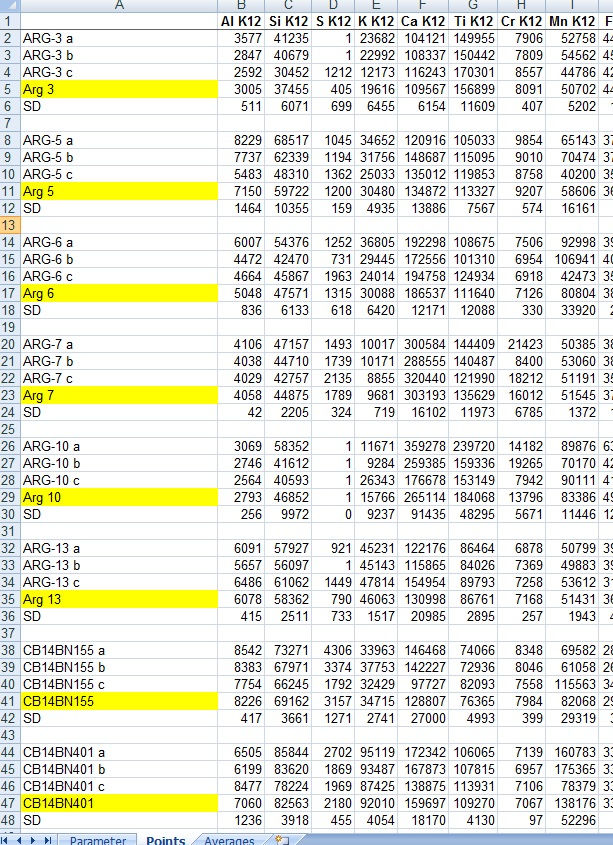
After defining the different spectral shapes (see previous blog post) and asking the software to calculate the net peak area counts for each element in the spectrum, I spit all this data out into an excel file. The image is a screen shot of a section of one of my files. On the left (column A) are all the samples, each of these samples were measured three times in the field (tagged a, b, c), the yellow label is the mean (average) value for the sample based on the three measurements. Why did I call it the mean value and not just the average value? Because there are three different ways of calculating the 'average' value, the mean, median, and mode. In this case we want the mean value (i.e. we add the values for a given element together and divide the total by the number of measurements). The final row, labelled 'SD' is the standard deviation of the measurements. This tells me how much variation there is between the measurements. The other columns then represent the different chemical elements that were measured. (Al, Si, S, K...). Why does each chemical element have K12 after it? This is because when the ARTAX software calculated the peak areas for these particular elements, it used the Kα fluorescence lines. For the elements here I can only measure K peaks with the pXRF, for heavier elements, such as lead (Pb), I cannot measure K peaks, but I can measure L and M peaks. (Remember, the different peaks relate to where an electron has dropped from a higher orbit to fill a gap in a given shell. So in this case L or M shell electrons are filling gaps in the K shell).
So, first I check to make sure that all the measurements make sense, you can see with sample Arg 3 that no sulphur (S) was really detected during the first two measurements, but the third measurement saw 1212 counts of S. This gives a mean value of 405 counts, but the standard deviation is 699 counts. So, something is not quite right here. I can look at my field notes and see that there was an air gap between the sample and the detector for measurement c. In this case, I would not use the S measurement at all. But I have to check all the elements for each and every sample. Finally, when I am happy with the data, then I can start comparing the mean values to each other. But now I have a new question...do I use the peak area counts as they are, or do I use ratios of peak area counts? The answer to that really depends on what type of analyses you are doing and the level of information you need. For this work I chose ratios. Based on a lot of previous lab work, I have a series of ratios that work really well for helping me identify groups within this type of ceramic material. I then make scatter plots to see whether all my data fits in one or more groups. I'm not allowed to give you the results of my actual fieldwork yet because this will be used to write interpretations about the use and provenance of the ceramics, and ultimately contribute to interpretations about the site as a whole. But I can show you a scatter plot from a different ceramic study to give you an idea of what I mean.

Comments